Unlock the Editor’s Digest for free
Roula Khalaf, Editor of the FT, selects her favourite stories in this weekly newsletter.
Good morning. Unhedged’s optimism about the US financial sector looks good, for one day at least. Yesterday shares in JPMorgan, Goldman Sachs, Citigroup and Wells Fargo, four of the five largest banks in America, rose 2 per cent, 6 per cent, 6.5 per cent and 6.7 per cent, respectively, after they all reported fourth-quarter results. The headlines focused on strong results in equity trading and bond issuance. But the read-through to the main street economy was positive as well: solid spending, stable credit quality and rising business optimism. If inflation doesn’t re-emerge (see below) and geopolitics gets no worse, 2025 might just be a good year. Email us: robert.armstrong@ft.com and aiden.reiter@ft.com.
Inflation
Today’s much-worried-about CPI inflation reading was, contrary to the market’s fears, not too hot. Headline inflation rose from 2.8 per cent to 2.9 per cent in December, just as economists expected. Core CPI, which strips out volatile food and energy, has been more or less sideways for five months now. It ticked down just a little, from 3.3 per cent to 3.2 per cent:

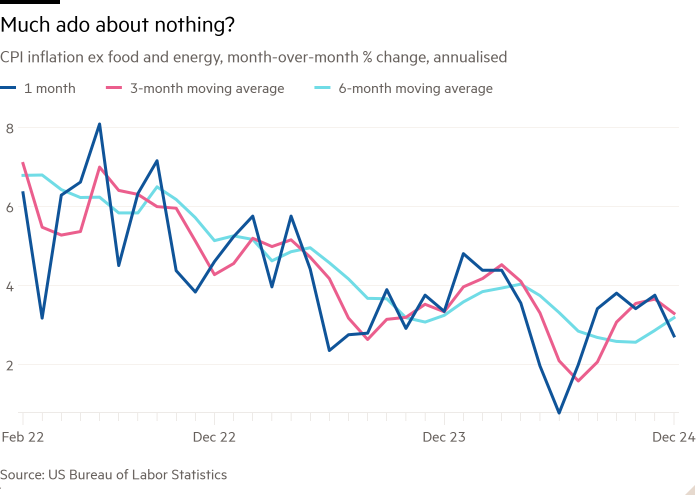
Unhedged’s preferred measure, month-to-month change in core inflation annualised, presents a rosier picture. The one month reading came down sharply, from 3.8 per cent to 2.7 per cent:

After a run of uncomfortably warm inflation readings and last week’s firm job report, the market — particularly the bond market — was desperate for relief. The headline and core numbers, as well as the report’s details, provide some.
A lot of the headline increase was down to a big jump in energy prices. Shelter, often the stickiest bit of the index, has continued to come down since September, when it first broke its rising trend. The one-month reading dropped sharply last month:

There were other notable areas of softness. Apparel and restaurants were flat, while appliances and furniture prices collapsed. The price increases, on the other hand, were quite broad-based. Among the increases were insurance, recreational services and delivery services.
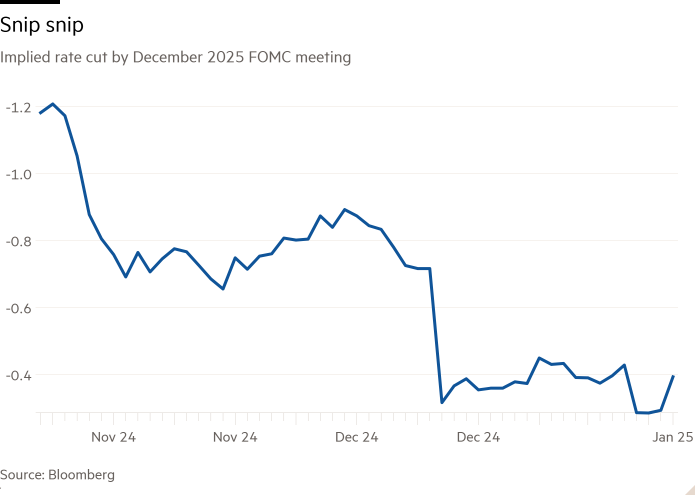
The market has taken the report as a sign that inflation will resume its descent. The market nudged up its bet on 2025 rate cuts a bit:

Two-year and 10-year Treasury yields came down too, and break-even inflation (the difference in yield between nominal and inflation-protected Treasuries) fell:
Plenty of research notes painted an optimistic picture, emphasising that “disinflation is still progressing”, as Samuel Tombs at Pantheon Macroeconomics put it, or that CPI was “tame”, as the team at Rosenberg Research had it.
Unhedged feels only a little reassurance. We thought inflation was all but beaten four months ago, and were wrong; once burnt, and all that. Despite this good report, however you look at it, core inflation is closer to 3 per cent than 2 per cent, and the trend is sideways, not down.
December showed a meaningful decline in Unhedged’s preferred measure — that is, after three choppy, hot reports. This is visible in the six-month average: there was clearly an upwards inflection point in September, and things have been running hot ever since. Remember, one month is just one month (OMIJOM!).
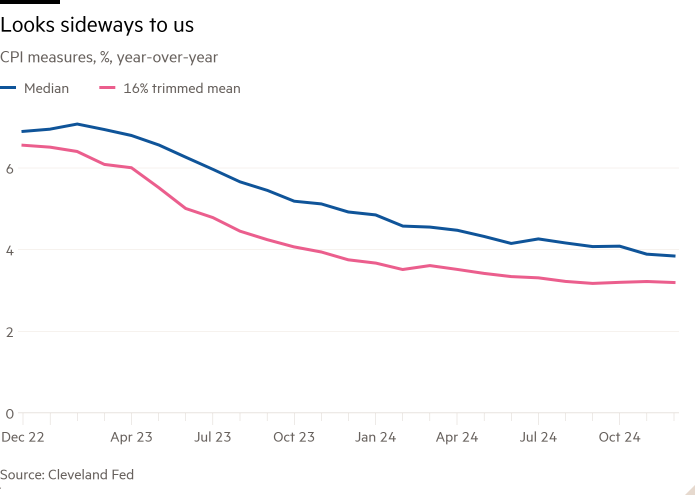
Another way to strip out some noise is the Cleveland Fed’s median CPI, which looks at the median price change in the basket, and 16 per cent trimmed mean CPI, which strips out the biggest negative and positive price changes. Together they give an idea of the general trend by taking out the biggest movers, whether they be energy, food, or something else. The trimmed mean is dead flat at over 3 per cent. The median is near 4 per cent, and falling only gently.

We’re hovering, and nearer 3 per cent than 2 per cent. Not bad, but not at the Fed’s target and, in a hot economy, perhaps not a stable equilibrium. This will keep the Fed on pause for now, and we’re still betting on one rate cut this year. Both the Fed and the incoming president should proceed cautiously.
(Reiter)
One good read
“Britain’s problem is that almost everyone names growth as their priority, and almost no one means it.”
FT Unhedged podcast

Can’t get enough of Unhedged? Listen to our new podcast, for a 15-minute dive into the latest markets news and financial headlines, twice a week. Catch up on past editions of the newsletter here.


