- Toncoin looked poised for recovery, but these hopes were shattered quickly after whales commenced selling
- Token lost 32% of its value in five days and the selling pressure has not eased
Toncoin [TON] looked quite bullish a week ago. It had climbed above the $3.95-local resistance towards the end of March, and was making higher lows during the process. This hinted at bullish potential and a recovery towards $4.8 on the charts.
In early April, however, the whale activity surged. The daily transactions spiked higher, but combined with the whale activity, it underlined a potential sell-off. Since then, TON has shed 26.6% in 8 days.
Are sellers getting considerably stronger than in late March?
Worrisome signs for Toncoin bulls
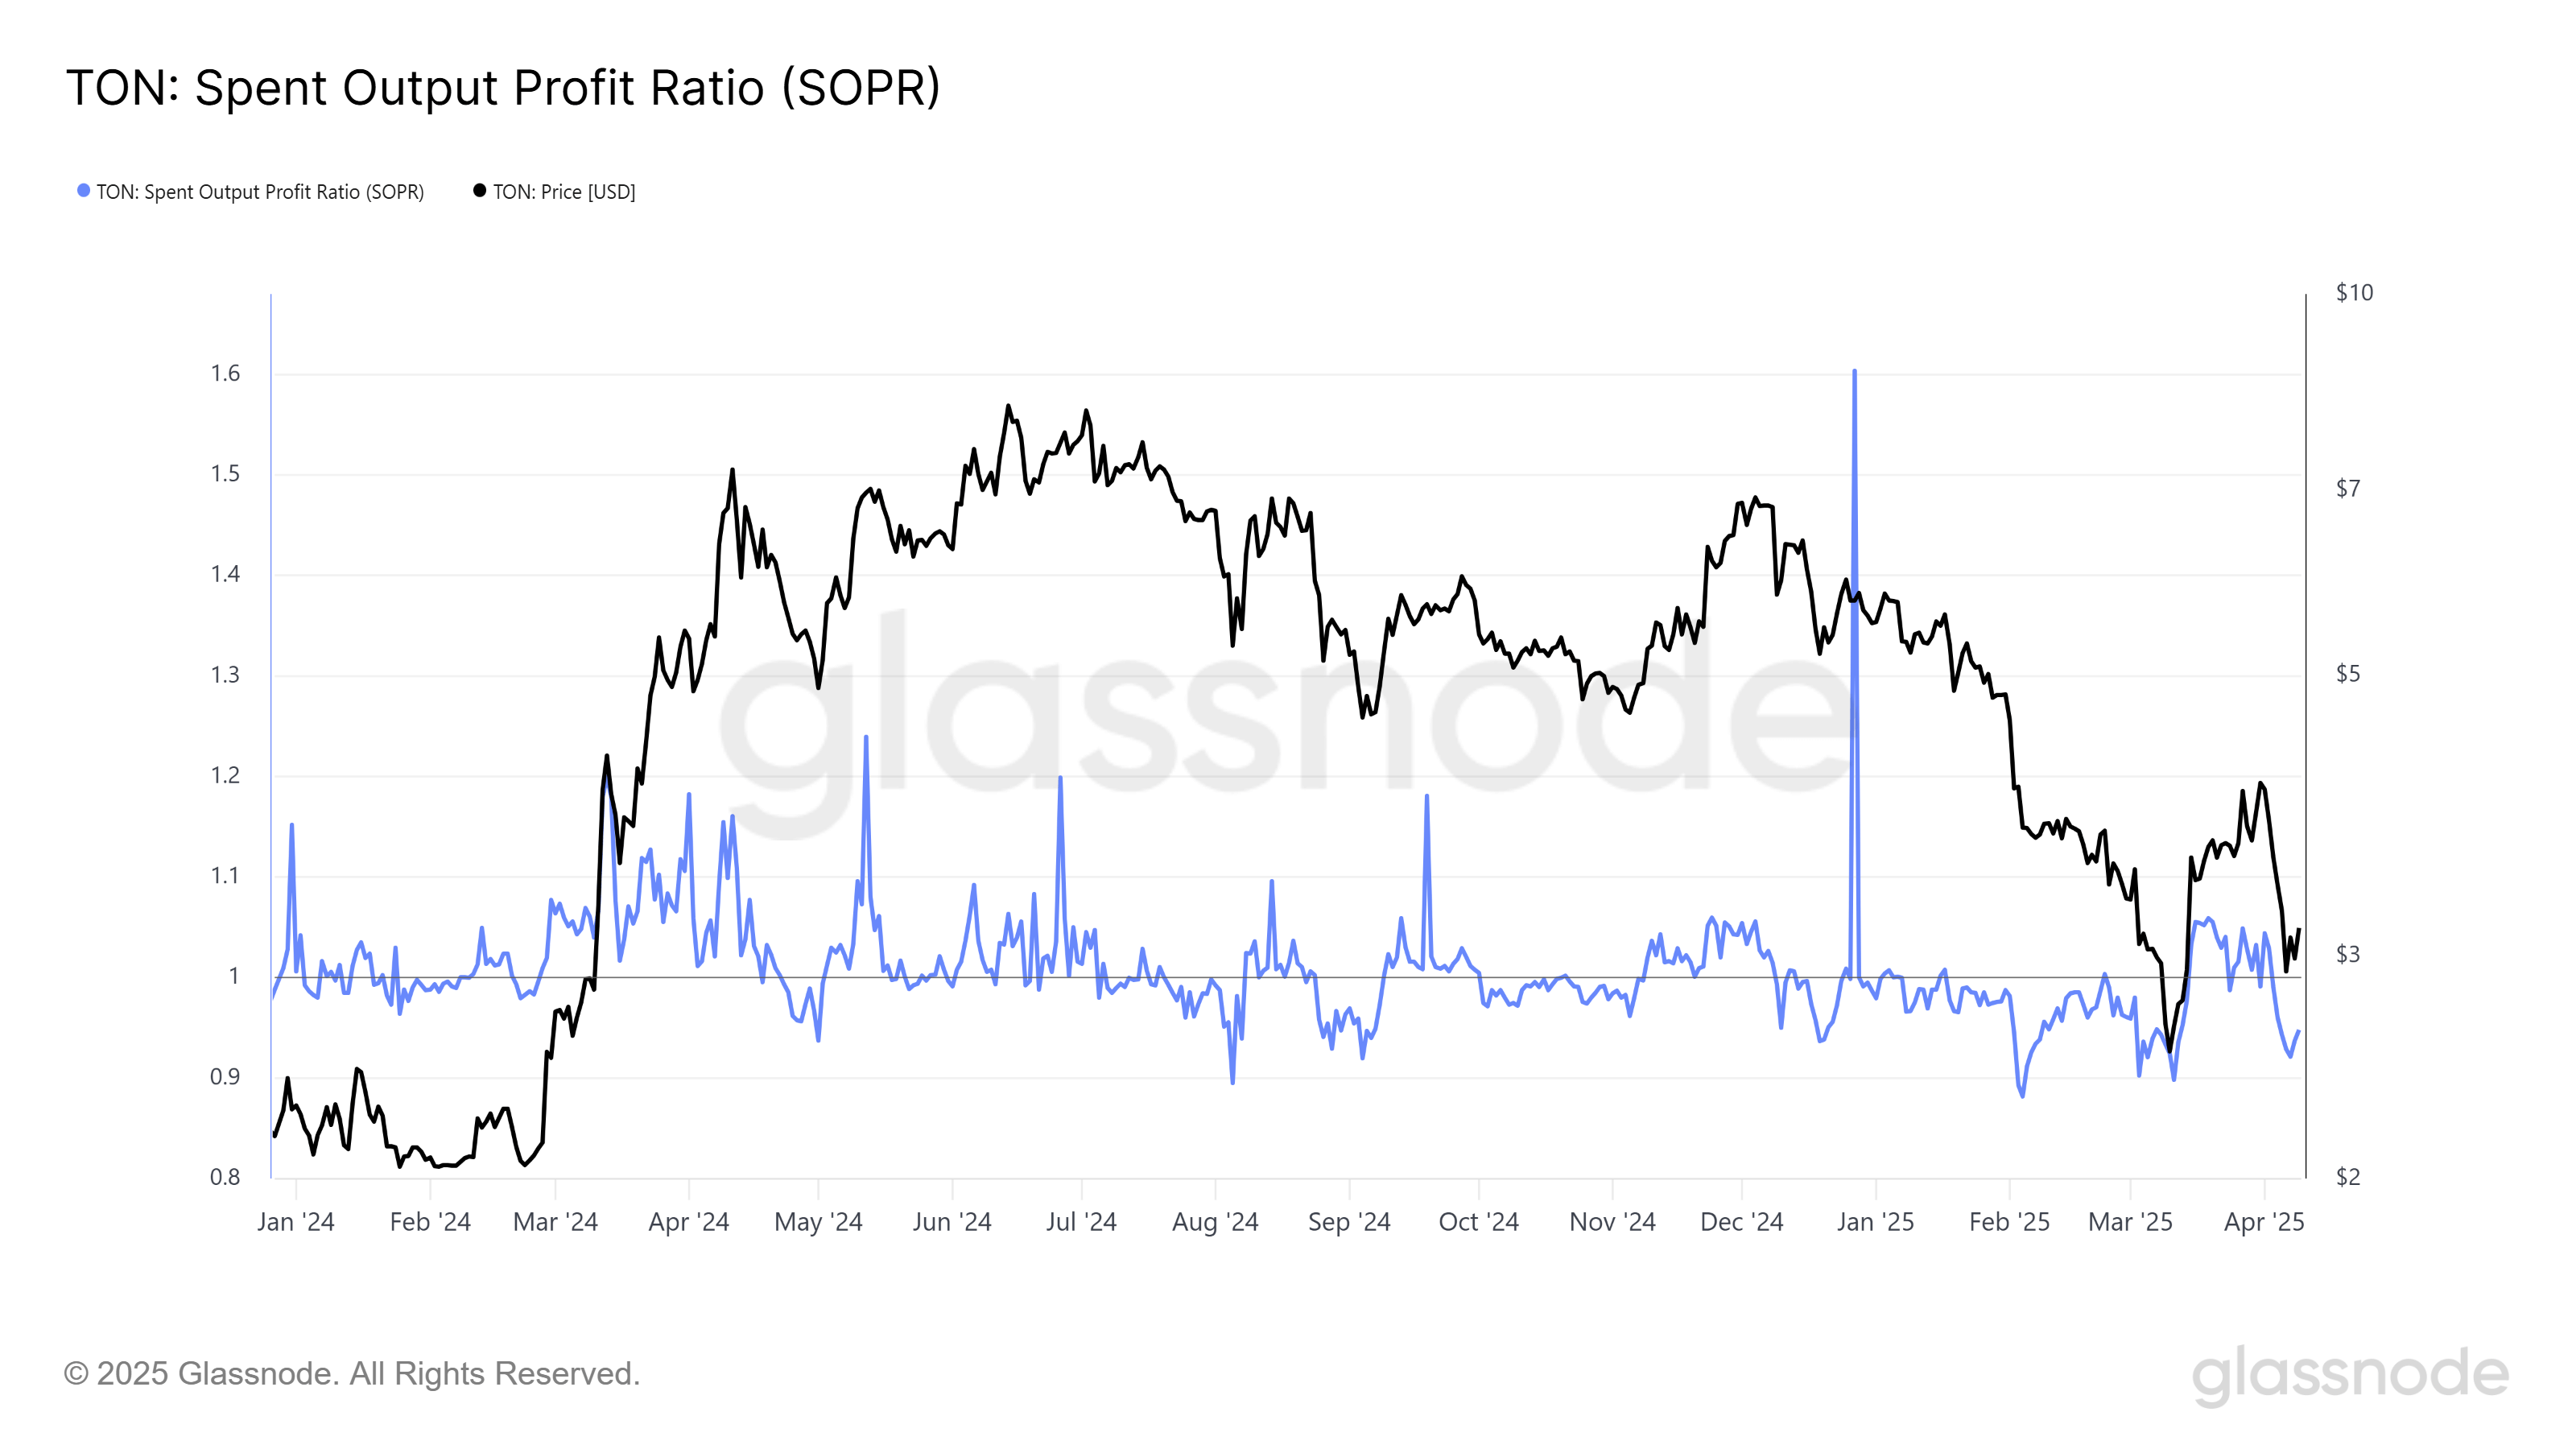
Source: Glassnode
The spent output profit ratio (SOPR) not only tracks whether TON is being sold at a profit or loss, but also compares the coins’ realized value to their value at creation. It is the value of TON when spent, divided by the value at which it was bought.
A drop below 1 meant that coins were being sold at a loss. Towards the end of March, the apparent recovery of TON saw the SOPR climb above 1. This ascent was short-lived though.
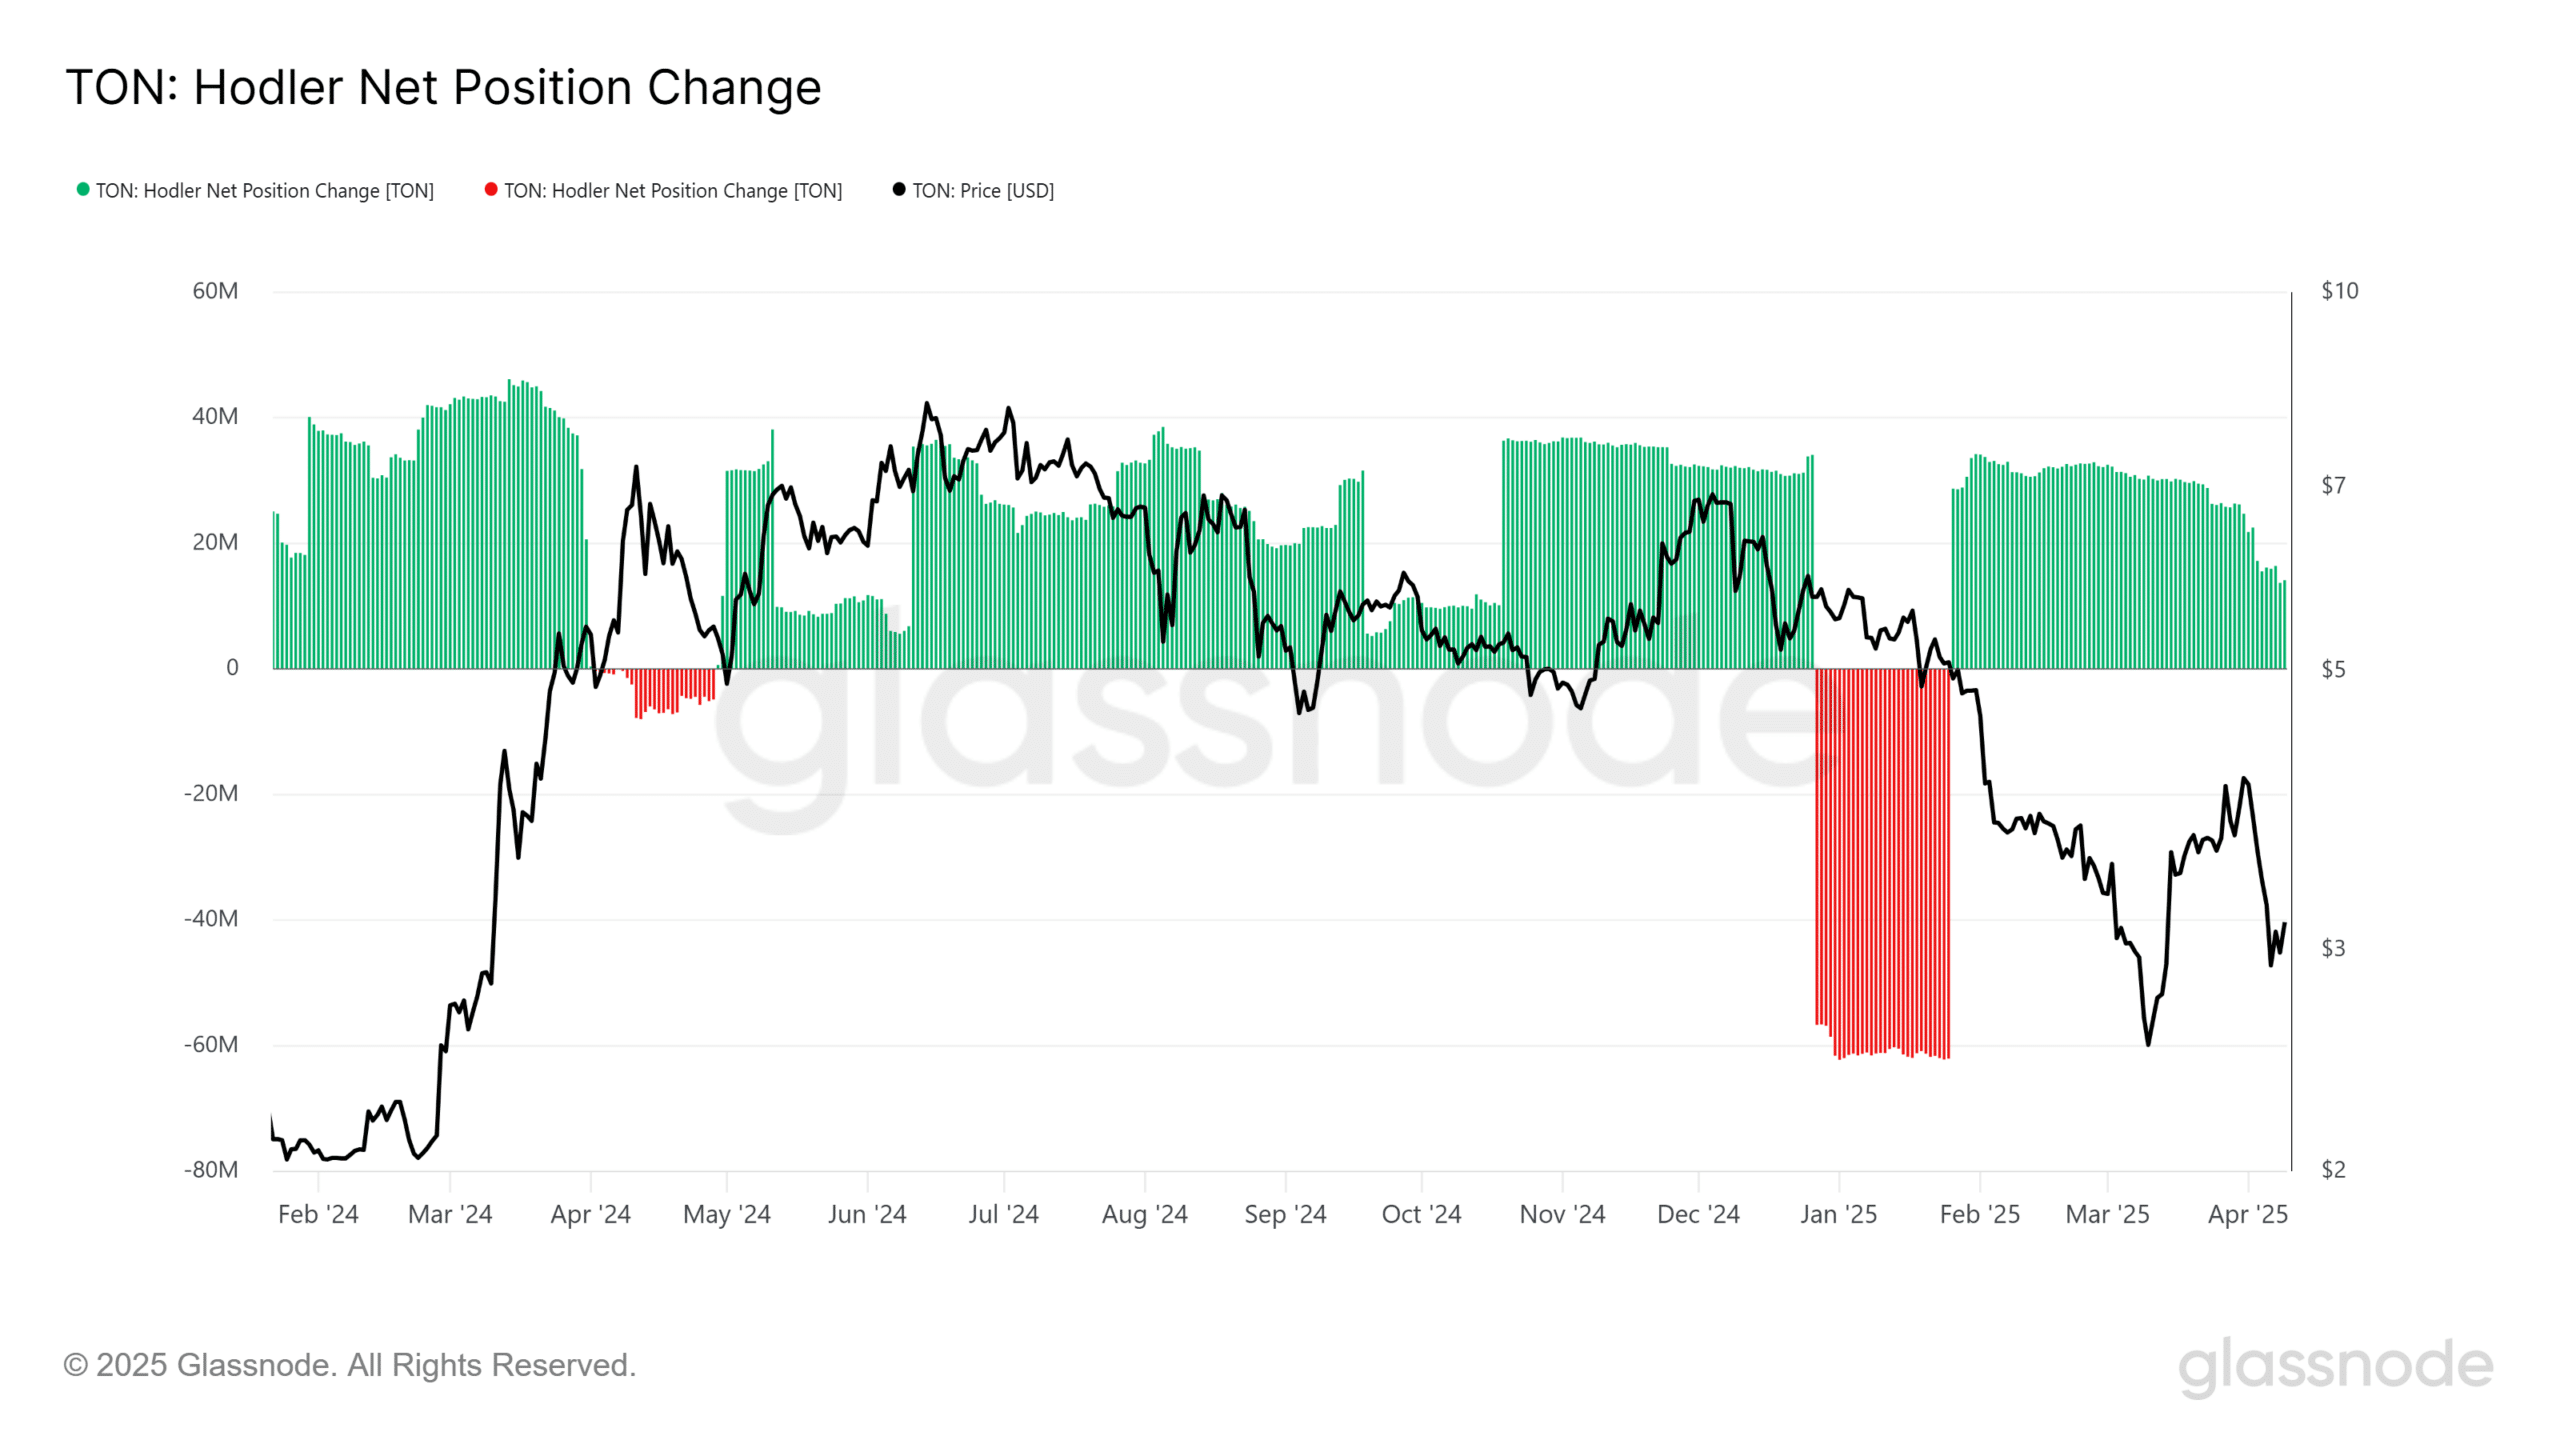
Source: Glassnode
The HODLer net position change metric revealed the monthly position change of long-term holders. Derived from the coin liveliness metric, it allows the net position metric to be computed to understand if the market is witnessing a transition from accumulation to distribution.
In February and March, accumulation appeared to be underway as the price trended downwards. Over the past ten days, the net position change has fallen even lower, indicating that holders were selling and a potential distribution phase was underway.
This seemed to link up well with the whale activity and the recent weakness of TON.

Source: TON/USDT on TradingView
The bullish market structure break occurred on 27 March when the lower high at $3.95 was surpassed. The CMF had been above +0.05. signaling strong capital inflows since mid-March. This turned around quickly.
Toncoin fell by 32% in five days, and the current outlook is bearish as a result. At the time of writing, the $3.5 support zone had not halted TON bears and the CMF was at -0.14 to denote high selling pressure.