- The VIRTUAL crypto market cap has advanced by 14% in the last 24 hours.
- The fear and greed index is at 74, which indicates greed among investors.
The price volatility of the Virtual Protocol crypto is high, resulting in 19.38%, which shows a higher probability of uncertain moves in the crypto price.
The crypto has good liquidity as its volume/market cap ratio is 5.42%, and the value of the traded volume of the crypto in the last 24 hours is $2.136M.
The value of the traded volume for the Virtual Protocol crypto has declined by 52% in the last 24 hours, showing a decline in the number of investors and traders engaging in crypto.
The Virtual Protocol market cap further has advanced by 8.65% in the last 24 hours from the press time. Despite this, the volume decline does not support this rise in the crypto market cap.
Also, the market cap presence of the crypto is very low, and its market cap ranking is #671, according to CoinMarketCap.
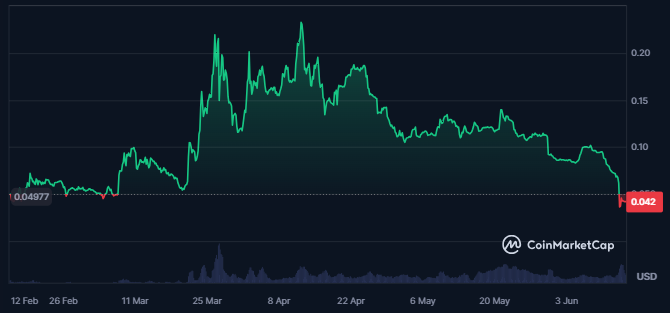
The Virtual Protocol token has 100% of the maximum supply circulating in the market. Its circulating supply is 1.0B VIRTUAL. The fully diluted market cap of the crypto is $42.049M.
The Virtual Protocol price is down by 82% from its all-time high price of $0.2417. However, the all-time high in crypto was achieved three months ago, on March 27, 2024.
The all-time low price was recorded just a day ago, and the crypto price is up by just 33%. It also does not trade with any fiat currency.
The rich list of the CoinCarp shows that Virtual Protocol has a total of 7,782 holding addresses, which has declined over time. Also, the top 10% of the holders have 80.08% of the supply.
VIRTUAL Crypto Technical Analysis
The VIRTUAL crypto price follows a strong downtrend, followed by the formation of consistent lower lows on the technical chart.

VIRTUAL crypto has been facing sellers’ dominance for more than 20 days and has lost its value by more than 70% from the swing high of $0.1459.
On the 4H chart of the VIRTUAL crypto, the most recent price action indicates a higher probability of a further decline in the trading price. That’s because the bullish candlesticks formed on the charts are small compared to the strong bearish candle formation.
VIRTUAL/USDT Chart by TradingView
The deviation between the trading price and the 50-day EMA on the chart is very high, showing strong bears’ dominance in the price. The crypto price has been trading below the crucial EMAs for a long time.
MACD and the signal line are trading in a bearish crossover and have sustained a negative trajectory, showing a negative crypto price trend.
The RSI has consistently sustained below the oversold zone, showing strong selling in the crypto and solid bearish momentum.
Summary
The VIRTUAL crypto is experiencing a strong downtrend, with consistent lower lows and a 70% loss from its recent high.
Despite a 14% market cap increase, trading volume has declined by 52%. Technical indicators, including MACD and RSI, signal ongoing bearish momentum, suggesting further price declines are likely.
The support levels for the VIRTUAL crypto are 0.040 and $0.030, followed by the resistance levels of $0.0820 and $0.100.
Disclaimer
This article is for informational purposes only and does not provide any financial, investment, or other advice. The author or any people mentioned in this article are not responsible for any financial loss that may occur from investing in or trading. Please do your research before making any financial decisions.