Stay informed with free updates
Simply sign up to the UK house prices myFT Digest — delivered directly to your inbox.
Only the richest 10 per cent of households in England could afford to buy a house with less than five years of household income in the year to March 2023, while property prices in London were unaffordable for any income group.
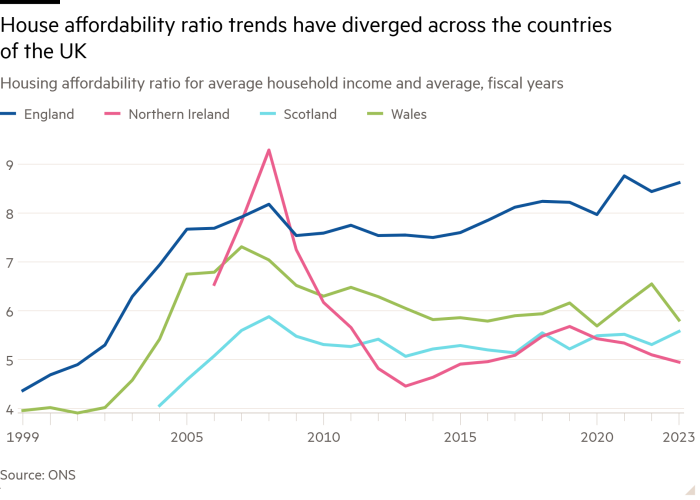
Average annual disposable house income stood at £34,569 in England in the 12 months to March last year, while the average house price was £298,000, a ratio of 8.6, the Office for National Statistics said on Monday.
The UK statistics agency defines properties costing more than five years of income as “unaffordable”. The affordability ratio in England hit a record 8.8 in the year to March 2021, before dipping to 8.4 in 2022. These moves and the latest increase reflect swings in house prices after interest rates rose rapidly from historical lows in 2020 and 2021.
For the poorest households, the average house price in England was 18.2 times above average income in 2022-23, with the affordability threshold being met only by the richest 10 per cent of households, at a ratio of 4.3, the ONS said.
London, where house prices are well above the national average, was alone among all UK nations and regions in that the average home was defined as unaffordable for all income groups.
The costs of the typical property in the capital was equivalent to almost 35 years of income for the poorest households, and 5.9 times the income of the richest households, above the affordability threshold, the agency said.
Stephen Perkins, managing director at broker Yellow Brick Mortgages, said the figures pointed to how it was “becoming increasingly difficult for households, especially the younger generation, to get on to the housing ladder”.
“Wages and disposable income simply cannot keep up with soaring house prices. For many aspiring homeowners, this data reveals the financial Everest they need to climb,” he added.
Boosting access to the property market has been a focus of Sir Keir Starmer’s government, with the prime minister vowing to “get Britain building again” and construct 1.5mn new homes in the current five-year parliament.
The last time England succeeded in building 300,000 new homes in a single year was 1969, with private and public sector housebuilding in England totalling about 200,000 new homes in the year to March 2024.

Chris Curtis, co-chair of the Labour Growth Group, a group of MPs inside the governing party, said the ONS data demonstrated “the staggering scale of our country’s housing crisis and underline the urgency of the task facing this government to end it”.
“We need to grow our economy so that rising pay packets mean it’s not just the privileged few who can afford to get on the housing ladder,” he added.
House prices have risen for most of this year, after contracting in 2023 when mortgage costs peaked, according to separate official data.
London’s affordability ratio of 14.1 in 2022-23, the latest year for which data is available, was down from a peak of 14.7 in 2016-17, when house prices in the capital started to underperform the national average. But the capital remained by far the region where properties cost the most relative to income.
In the year to March 2023, the affordability ratios in Northern Ireland, Scotland and Wales remained close to their 10-year averages at 5, 5.6 and 5.8 respectively.
In England, house prices were defined as affordable until 2001, but they have since increased twice as fast as household income.


