- LINK’s price performance showed that the downtrend remained intact on the daily chart
- On-chain metrics suggested that the token will not match the previous run’s performance
Chainlink [LINK] saw a strong pump on Sunday, 2 March, after the announcement of a U.S strategic crypto reserve. This was followed by the U.S President confirming tariffs on Mexico and Canada and additional tariffs on Chinese imports.
This contributed to the Dow dropping by 2.53% from Monday’s highs.

Source: LINK/USDT on TradingView
Consequently, the entire crypto market went lower, and LINK was forced to retrace the weekend pump, just like Bitcoin [BTC]. Did the longer-term metrics show more positivity for Chainlink holders?
Falling LINK transfers on-chain alongside price decline affects NVT

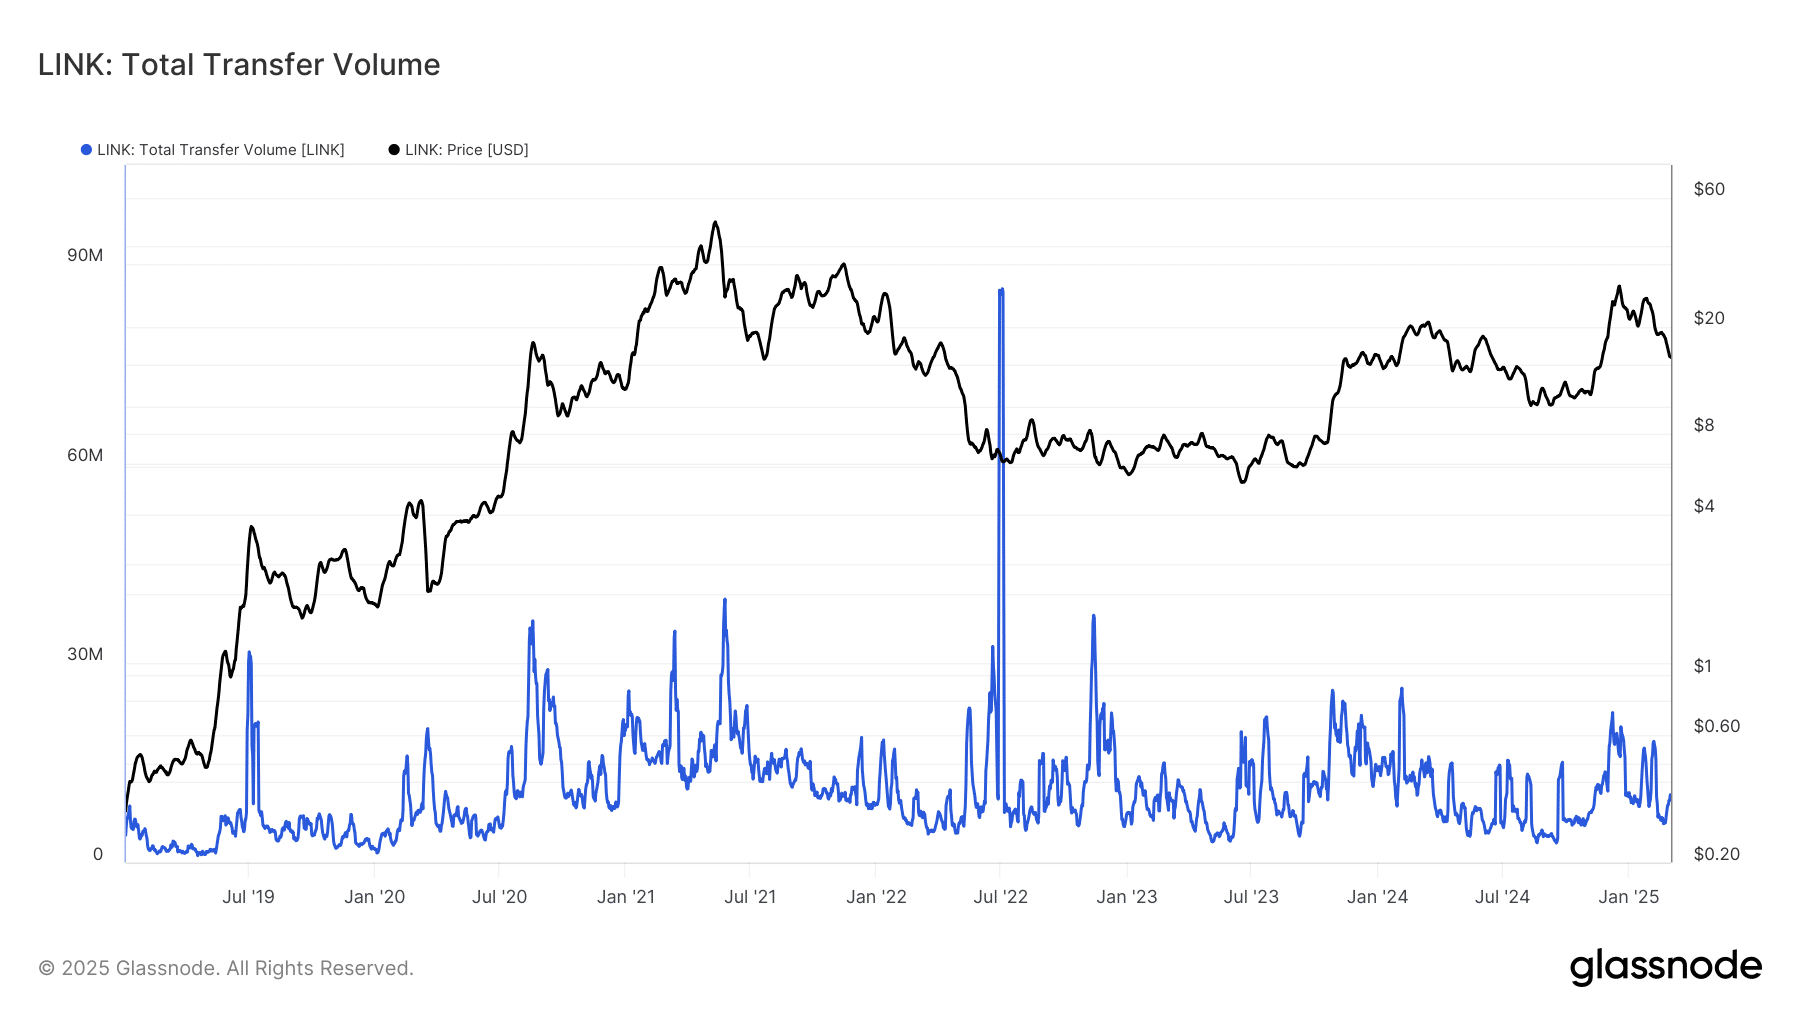
Source: Glassnode
The Network Value to Transactions (NVT) metric divides the market cap by the transferred on-chain volume in USD. A higher NVT implies the market cap is high relative to the volume transfer, which means an overvalued asset like a heightened P/E ratio does with stocks.
In September 2024, the NVT hit its highest point it had since January 2020, because the on-chain volume fell to its July 2023 lows. Thereafter, the volume picked up, forcing the NVT down during the November-December price rally.
Source: Glassnode
The aforementioned chart highlighted LINK’s transfer volume.
Over the past two months, it had begun to trend south, especially as lowered prices reduced the enthusiasm behind LINK and affected user numbers. At press time, the NVT chart had begun to trend higher as well.
Should investors look to take profits more aggressively?

Source: Glassnode
The MVRV ratio gave an even better insight into market sentiment. It gave a clearer idea about the fair price of Chainlink. At press time, the MVRV ratio was 1.29, which meant that holders were, on average, at a decent profit.
And yet, the MVRV was nowhere near the levels it reached in 2020 and 2021. Even so, the altcoin market has diluted enormously in the last four years. It might be that LINK’s MVRV will never reach the profit levels from 2020 because LINK bulls were relatively weaker.
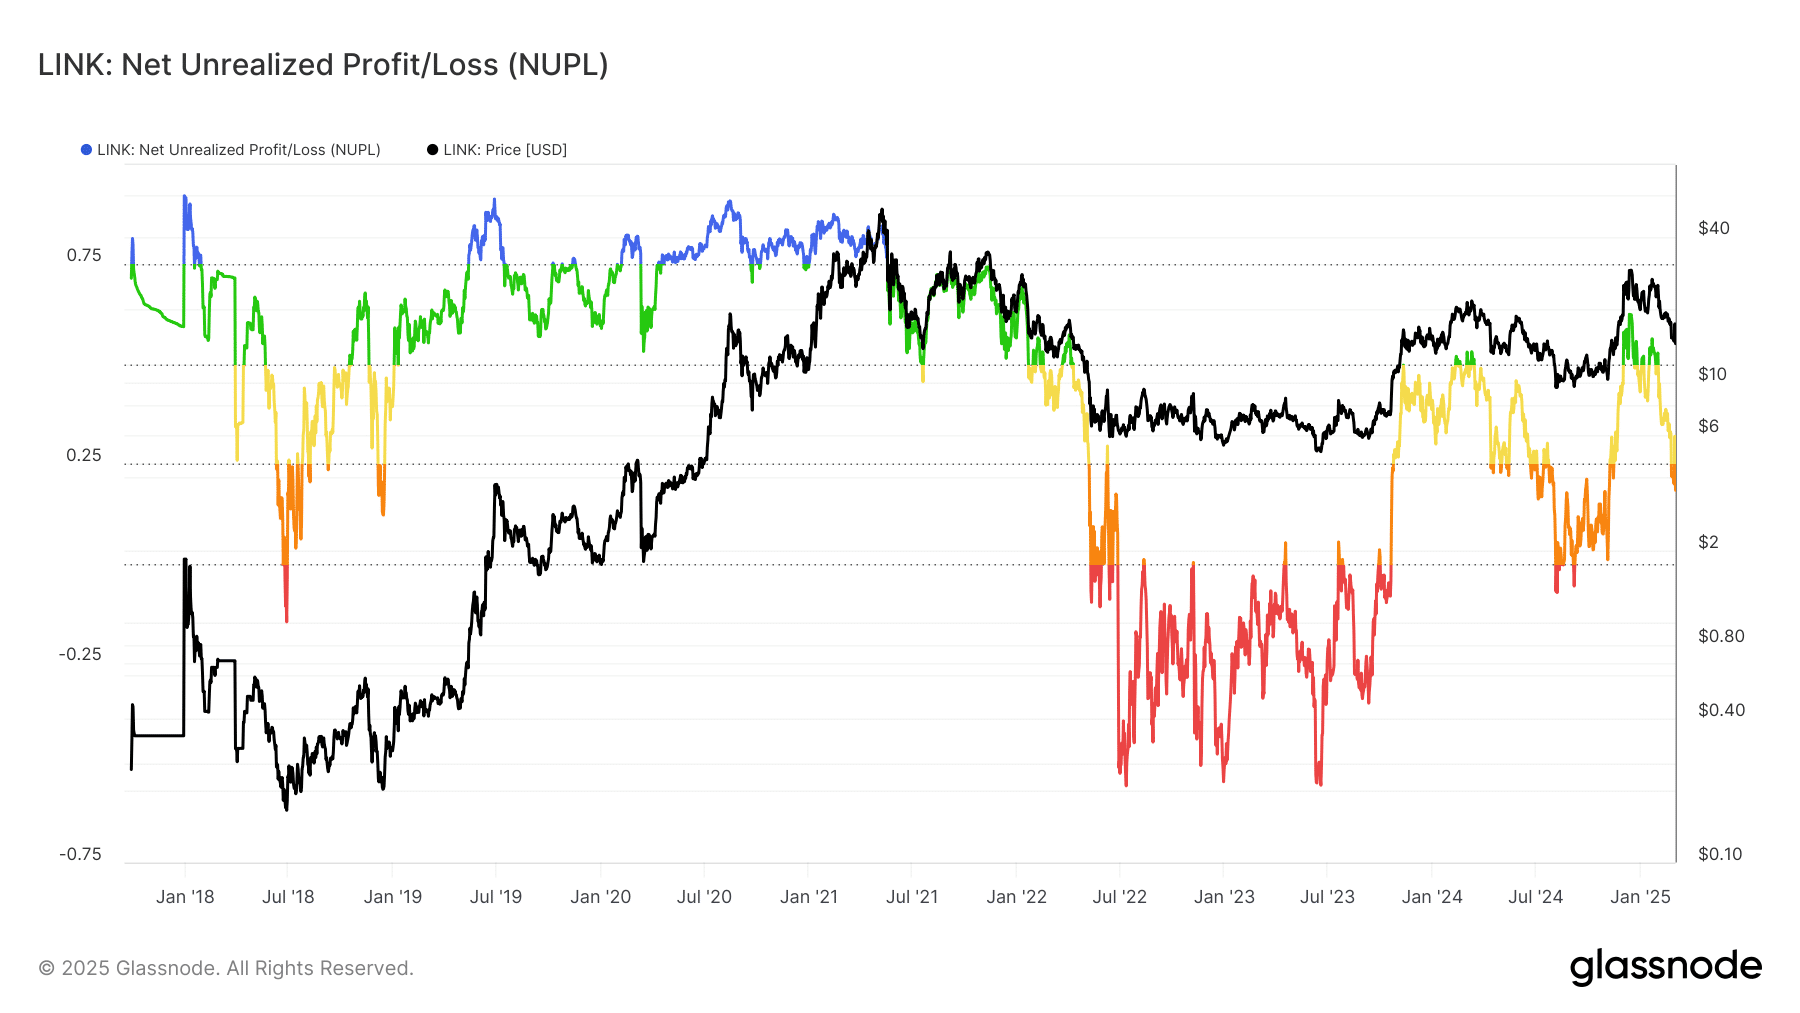
Source: Glassnode
The NUPL is the ratio of relative unrealized profits to relative unrealized loss. A high ratio means more investors are at unrealized profits, which would mean that the market is greedy. For Chainlink, the opposite has been true.
The sliding prices in recent weeks meant the ratio began to tip towards fearful sentiment. Its 0.18 value was well away from the 0.62-level from December, showing unrealized profits have been eaten away by the downtrend.
The metric did not fall below 0.55 in the 2020-21 run, but struggled to clear this level over the past six months. This highlighted the vast difference in LINK’s performance between cycles. Perhaps, holders should be more aggressive in taking profits if the downtrend reverses in the coming months.