- Bitcoin price dropped $67,000 to $59,000 in two days.
- PlanB says the current Bitcoin sideways bull market is unusual.
- BTC is currently facing strong resistance near $62,000, and it is at risk of falling to $56,000.
Bitcoin price dropped sharply on Wednesday after Iran went on the offensive, launching over 180 rocket missiles at Israel. The fear of increased conflict gripped the markets as BTC prices dropped $67,000 to $59,000 in two days. But is the Bitcoin crash over? Technical analysis, right so far, says No.
2024 “Bitcoin Sideways Bull Market is Strange,” Says Top Analyst
In a recent market analysis, the creator of the stock-to-flow (S2F) model, PlanB, noted that Bitcoin has been trading in a sideways range between $60,000 and $70,000 for eight months. This is unusual because, historically, bull markets have seen prices rise.
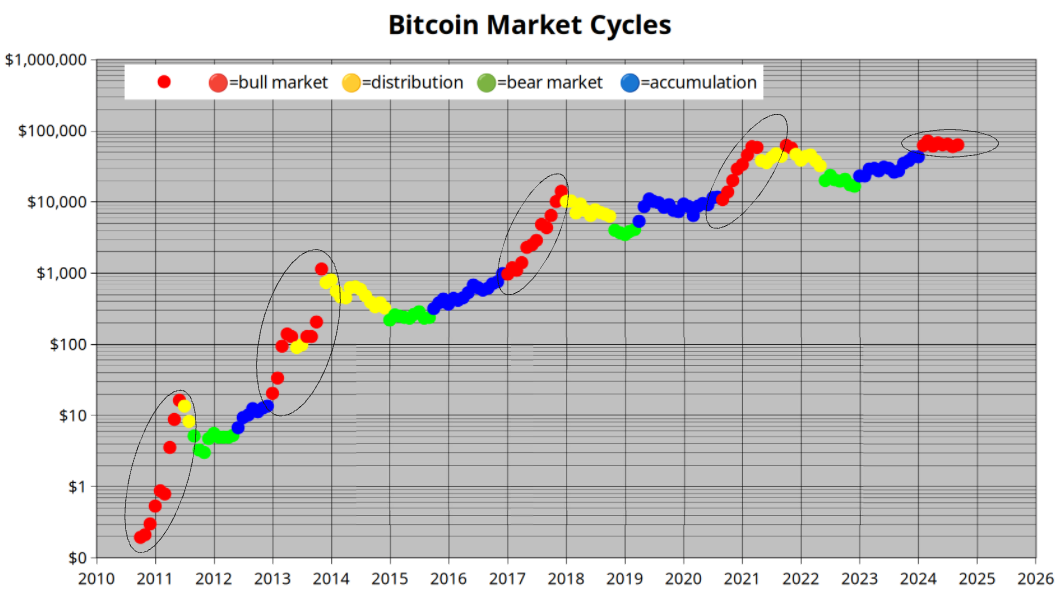
This sideways movement could be due to manipulation, but it’s unlikely to last for eight months. Another explanation is a pre-halving pump, which is a price increase before the halving event. This pump was too early and resulted in a flat period.
PlanB compared the period 2019-2020 to the current situation, noting that both periods had a pre-halving pump and then a flat period. The positive thing is that the moving average is still increasing.
He argues that the current flat bull run is due to large buyers waiting for the US elections in November. A Democratic win could be bad for Bitcoin, which could explain the sideways price movement.
BTC Price Statistics Today
- Bitcoin Market Cap Dominance: 54.4% ⬆
- Bitcoin Market Cap: $1.215 trillion ⬇
- Circulating supply: 19.762 million ⬆
- Percentage Mined: 94.11%
Previous Bitcoin Price Analysis
Last week’s market wrap had Bitcoin price soaring amid a surge in ETF inflows. BTC price was expected to continue surging and test the $70,000 level before deciding on the next move.
However, fear, uncertainty, and doubt (FUD) resulting from the Iran attack on Israel on Wednesday caused the markets to dump. Bitcoin price dropped from $67,000 to just below $60,000.
BTC price has recovered and is trading at $61,523, a 1.5% increase in the last 24 hours.
Bitcoin Price Analysis: All Eyes on $56,000
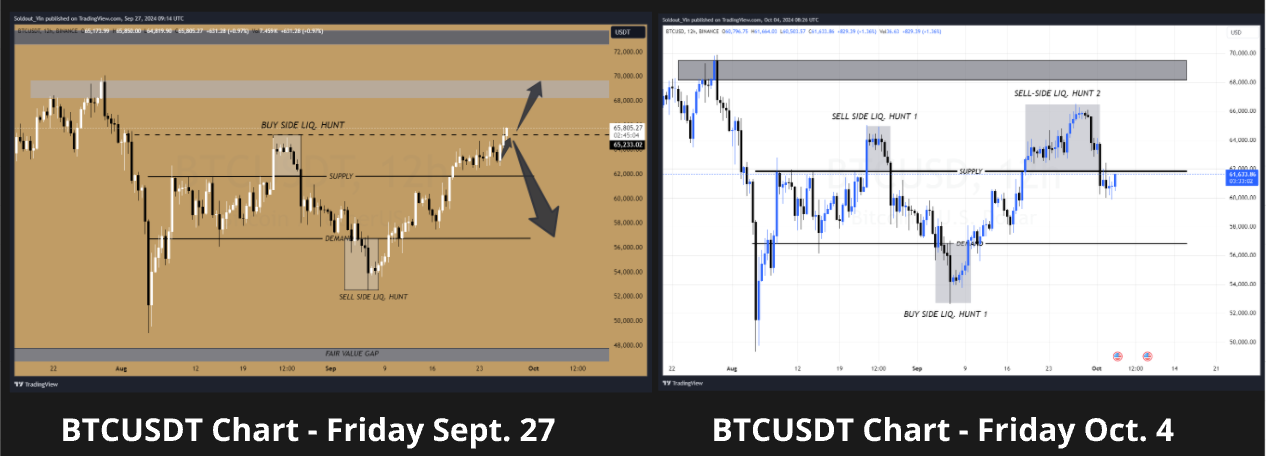
The Bitcoin price chart shows two liquidity hunts (sell-side hunts), where the BTC price was pushed up to the liquidity zones near $64,000 and $66,000, triggering stop-losses or short positions and indicating market manipulation or profit-taking by large players.
After these liquidity hunts, the price has fallen back toward the $61,500 region, which is below a key supply zone.
A major support level lies around $56,000, indicated by the arrow on the chart. This support level is crucial as it aligns with previous liquidity and demand zones from mid-August and early September.
On the flip side, the primary resistance is located at $62,000, where a supply zone acts as a ceiling for the price.
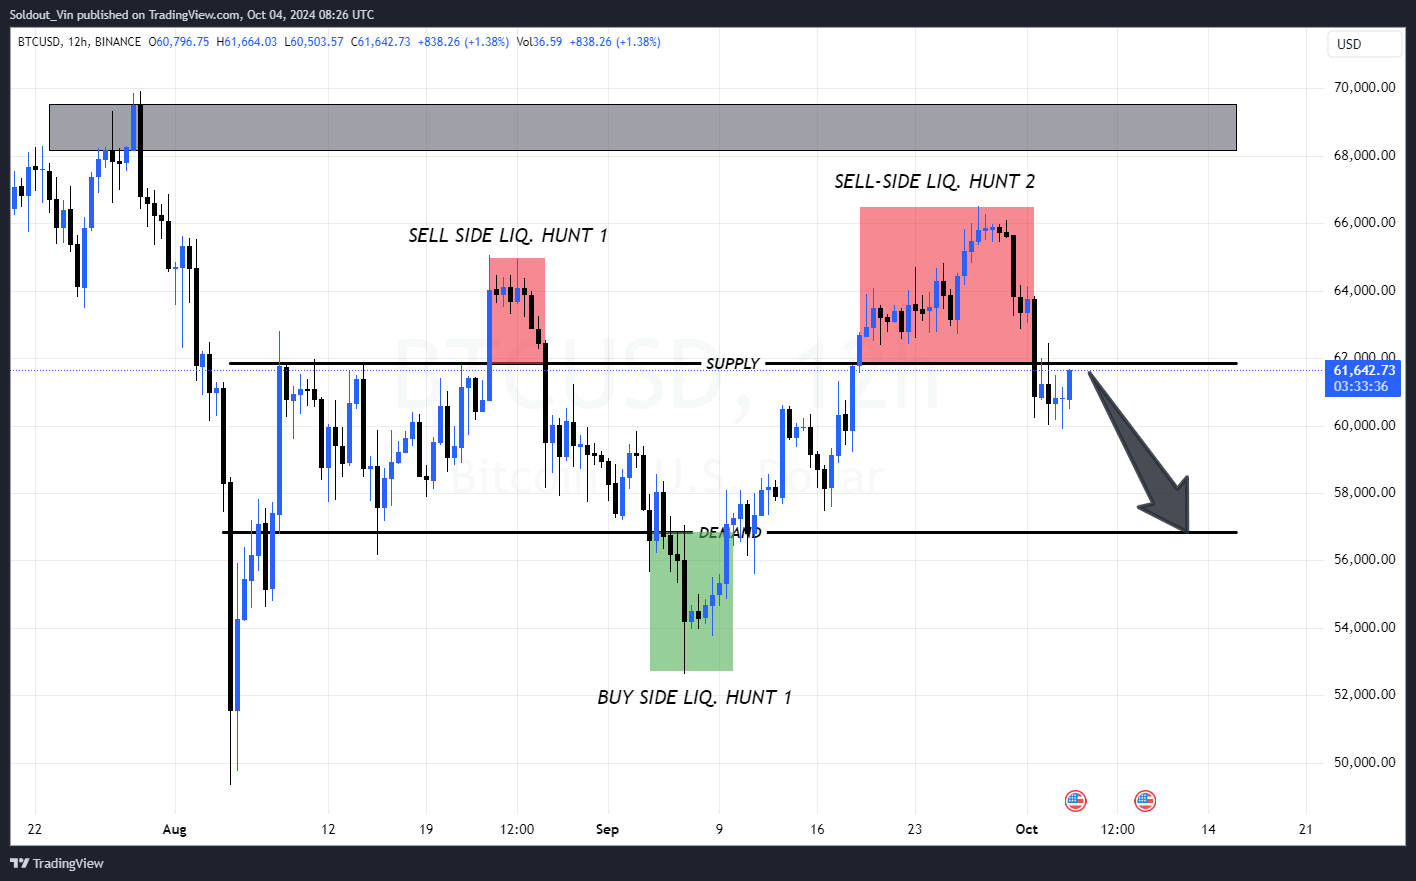
BTC is currently facing strong resistance near the $62,000 supply zone, and the multiple liquidity hunts suggest further downside risk toward $56,000. If the price breaks below $60,000, expect further selling pressure.
DISCLAIMER: The work included in this article is based on current events, technical charts, company news releases, and the author’s opinions. It may contain errors, and you shouldn’t make any investment decisions based solely on what you read here.
READ SOURCE