- QNT faced critical resistance levels; key support at $89 could determine its next move.
- Declining address activity and rising NVT ratio suggested potential market correction ahead.
Quant [QNT] has been showing bullish sentiment, fueled by strong support from both retail and smart money investors.
However, despite this positive outlook, key resistance levels and a decline in address activity suggest the token may face some challenges. At press time, QNT was trading at $89.21, marking a 1.33% decline over the past 24 hours.
As the market continues to evaluate QNT’s future, there are growing concerns about whether the token can maintain its current momentum.
Quant chart outlook: A critical crossroads
Quant’s price chart reveals a significant technical pattern. The asset has recently broken below its demand zone and is now testing key support around $89. If this support level fails to hold, the price may drop toward $72.65.
However, if QNT rebounds from this zone, it could push toward $101.8, where it faces considerable resistance.
With a potential pennant flag breakdown in play, investors must remain vigilant about the possibility of a bearish trend if support levels are not maintained.
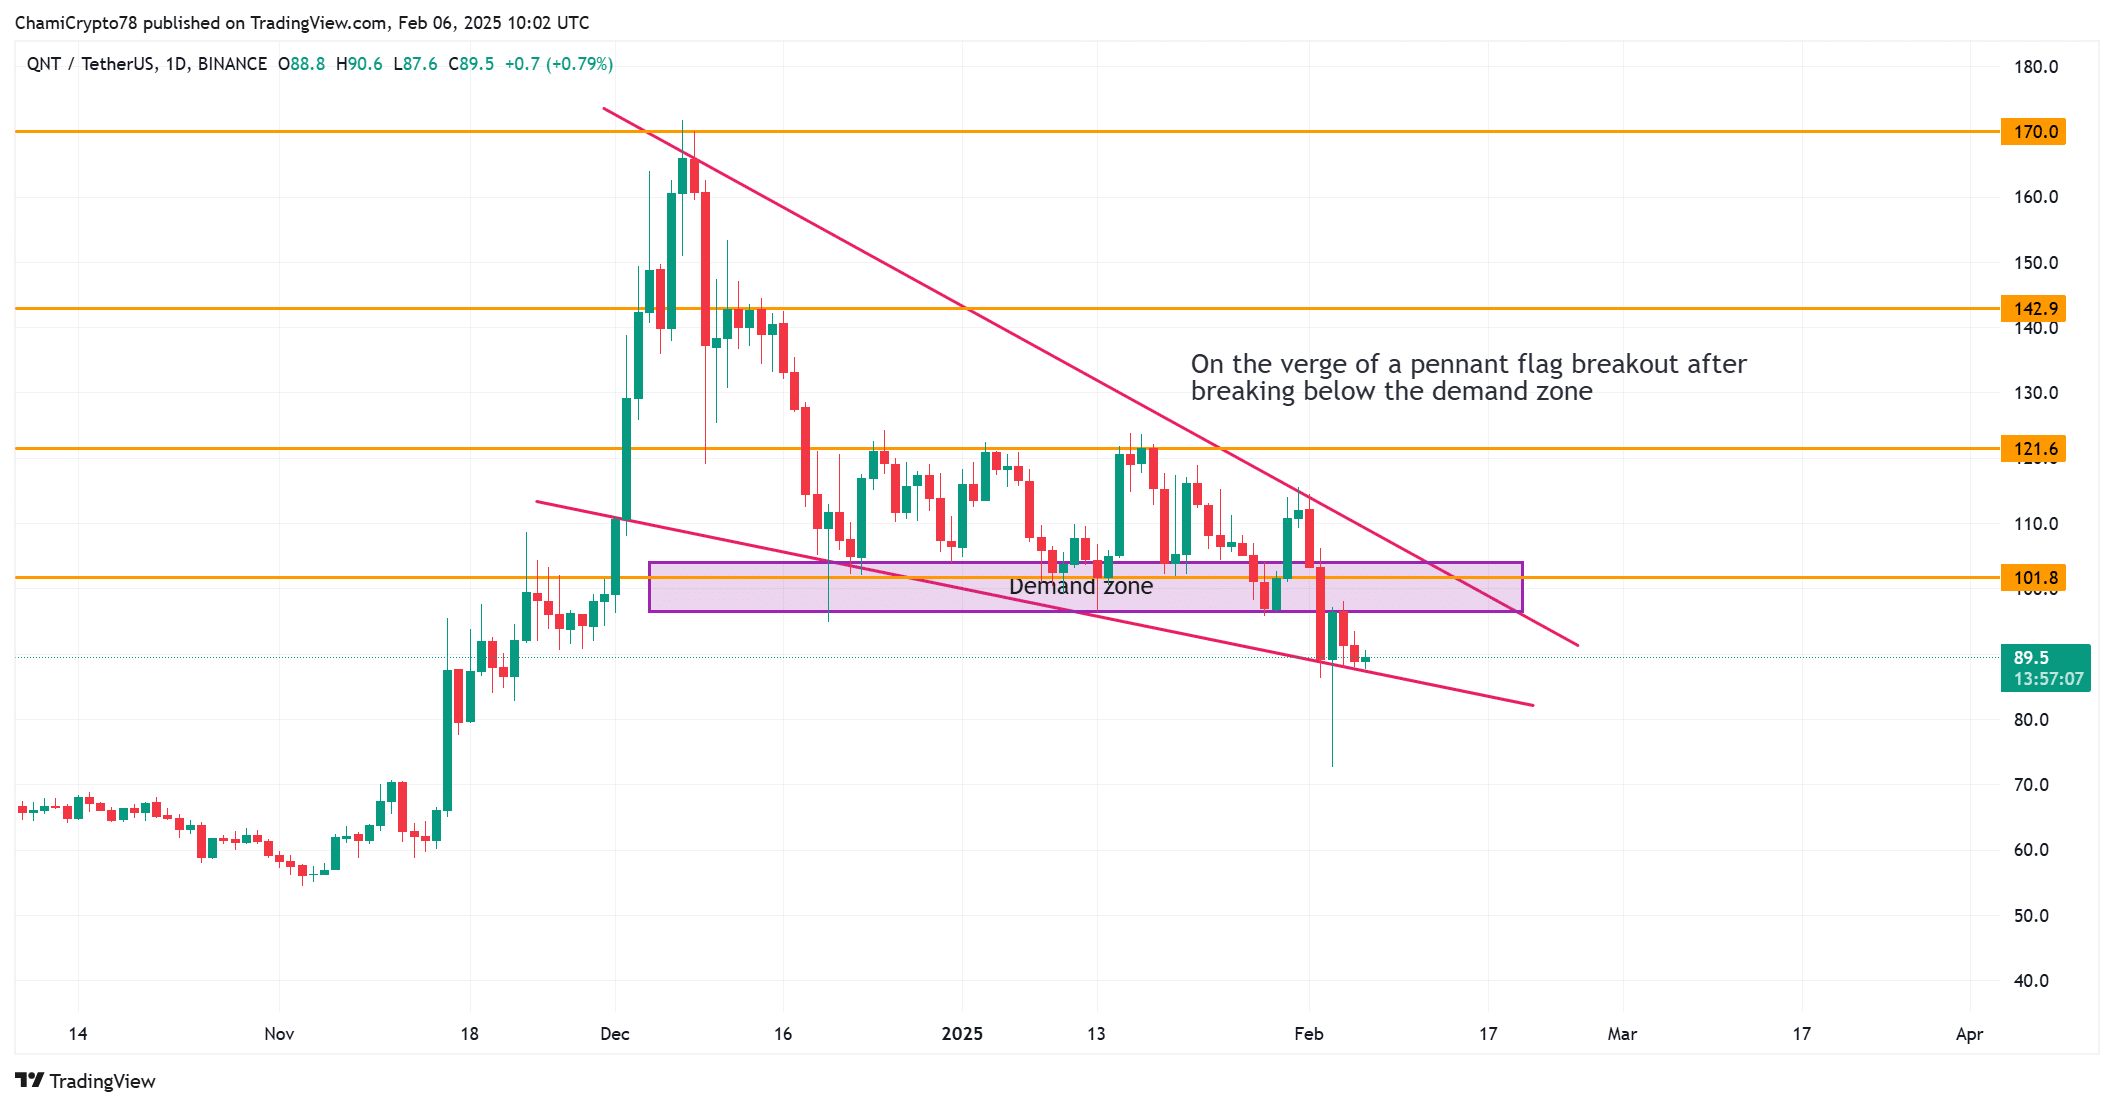
Source: TradingView
QNT In/Out of the Money: A sign of caution?
At press time, the “In/Out of the Money” chart indicates that 61.65% of QNT holders were profitable. However, 33.59% of addresses are “Out of the Money,” with significant resistance levels between $95.39 and $106.08.
This disparity highlights the challenges QNT faces in overcoming these price barriers.
If these resistance levels are not broken, the market could experience a reversal as holders look to lock in profits.
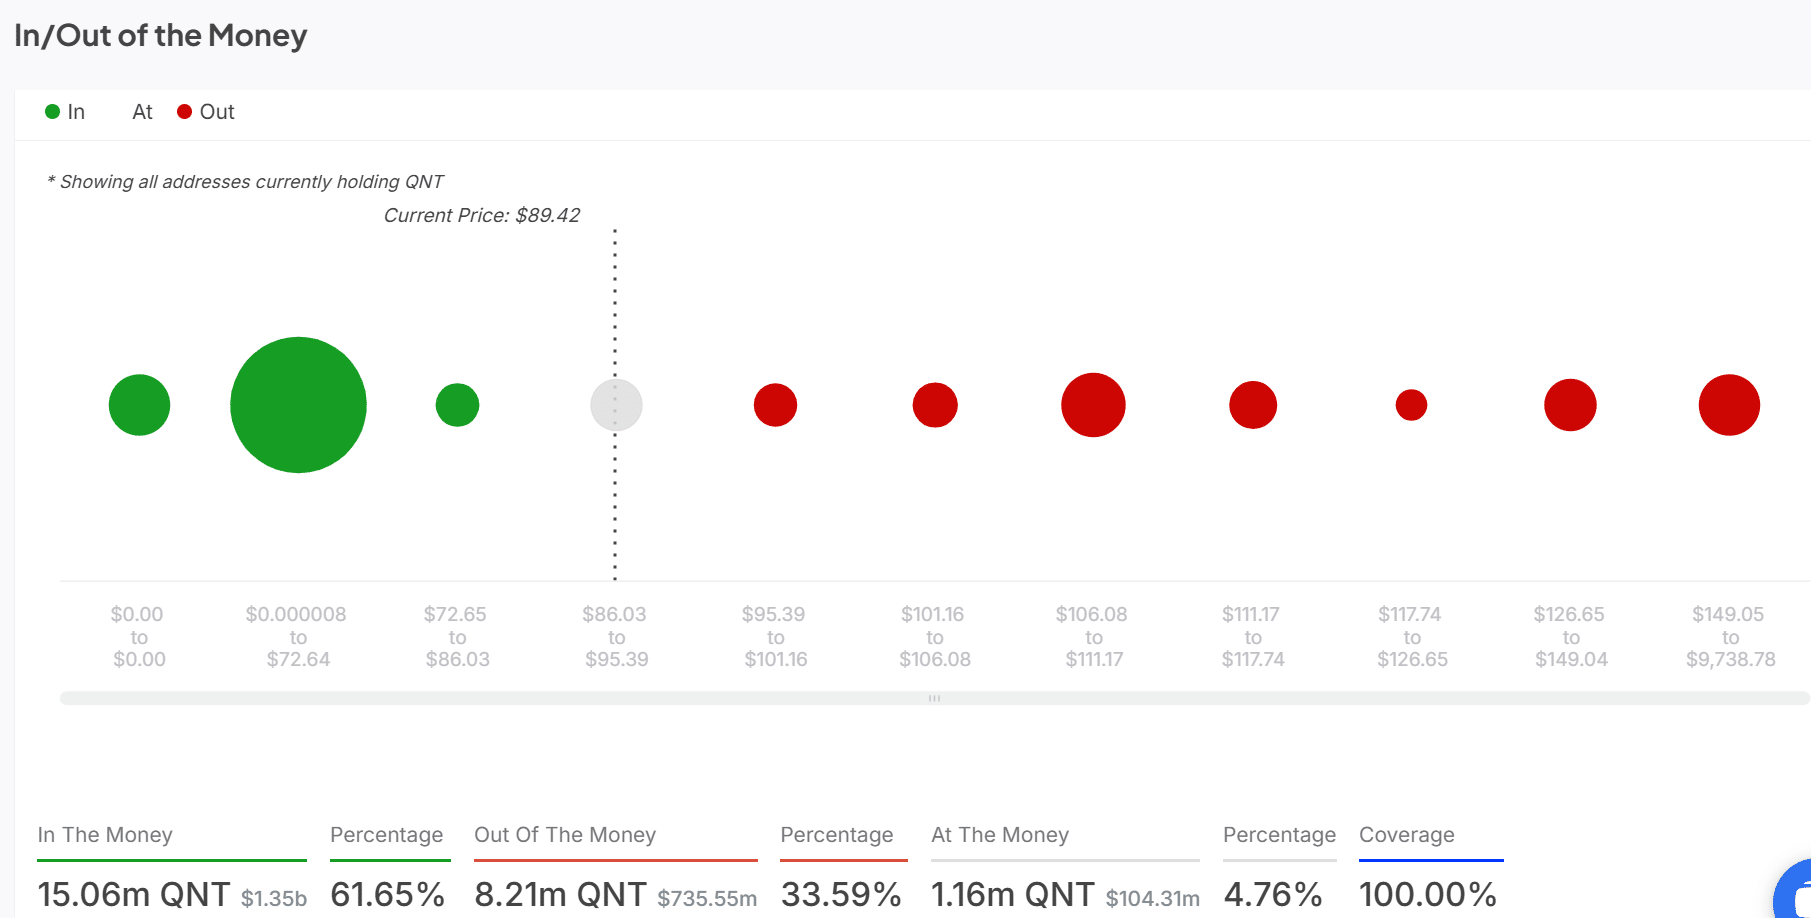
Source: IntoTheBlock
QNT addresses stats: Declining interest?
Address activity has shown signs of decline, with new addresses dropping by 27.05% in the past week and active addresses decreasing by 11.67%.
This reduction in interest could limit the potential for QNT to push higher, as it suggests that fresh capital is not flowing into the token. With declining participation from both new and active addresses, QNT may face a more challenging path to recovery.

Source: IntoTheBlock
NVT Ratio: A huge surge raises concerns
The Network Value to Transaction (NVT) ratio has surged to an all-time high of 1123.47. This signals a disconnect between Quant’s network value and its actual transaction volume.
A rising NVT ratio is often indicative of an overvalued market, as the price increases without a corresponding rise in transactions.
This sharp increase in the NVT ratio raises concerns that QNT may be overbought, and a correction could be imminent.

Source: Santiment
Conclusion: The path ahead for Quant
Quant’s market outlook was at a crossroads, with resistance levels, declining address activity, and an increased NVT ratio signaling potential challenges ahead.
Read Quant’s [QNT] Price Prediction 2024–2025
Although the sentiment remains largely bullish, QNT faces key technical and market hurdles.
It will need to hold support at $89.21 and break through resistance at $95.39 to maintain its upward momentum. Should these levels not hold, a price correction could be on the horizon.