- Solana has been affected by a few bearish updates over the past month
- Price began to accelerate downwards and sustained selling pressure meant a recovery had not begun
Solana [SOL] has faced significant losses over the past month. Solana’s news cycle also revealed plenty of bearish developments alongside its price action. For instance, in a report last weekend, it was noted that reduced demand and network activity could drive SOL‘s price lower.
A 38% fall in DEX activity did not aid the bullish cause. Neither did the news of a drop in total value locked (TVL). A closer look at the price charts revealed that $140-$150 would be key for recovery.
SOL in a freefall below $180- is $120 next?

Source: SOL/USDT on TradingView
The retest of $180 as resistance on 20 February was followed by a 21.45% price drop. A few days ago, Bitcoin [BTC] had been holding on above the $95.5k-level. Its quick plunge below $90k, combined with the bearish sentiment, sent SOL tumbling.
The OBV has been trending south since late January. It had been forming lower lows since late November, but the rally in January and the demand that accompanied it showed that the downtrend might not impose itself.
The RSI on the daily chart was at oversold levels. While it did not guarantee an immediate recovery, it hinted that the $135-level could serve as temporary support.
The loss of the $151-level, which was the 78.6% Fibonacci retracement level, meant that the $120-low from September would be the the next target.
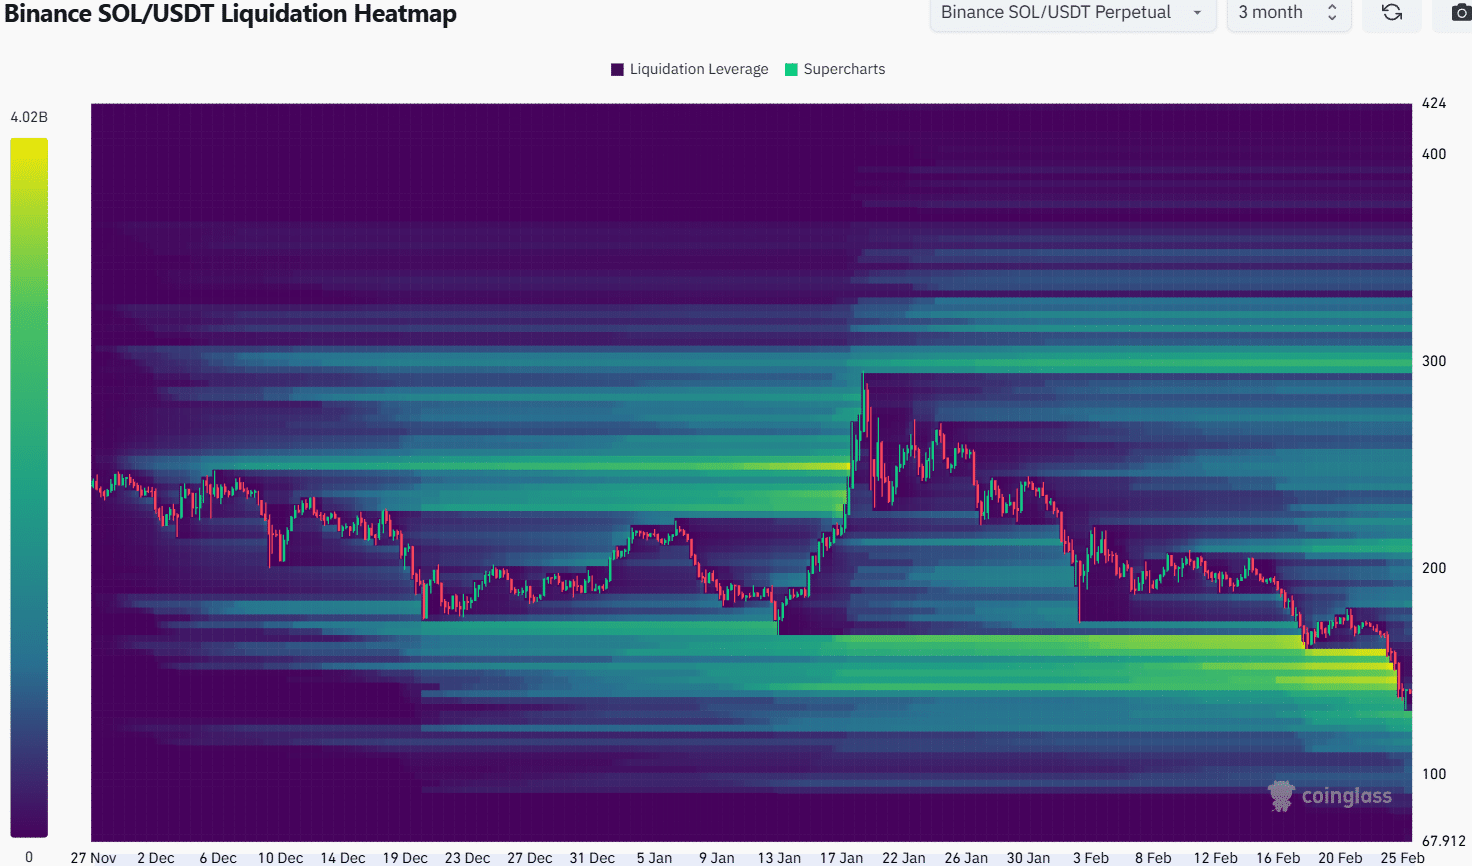
Source: Coinglass
The 3-month liquidation heatmap showed that the cluster of liquidation levels from $165 to $135 has been taken out. There are some liquidation levels at $125 that could be an immediate target.
If SOL can push itself back above $150, it could begin to consolidate in the $140-$160 zone. The price is attracted to large pockets of liquidity, but are there any nearby levels of significance?
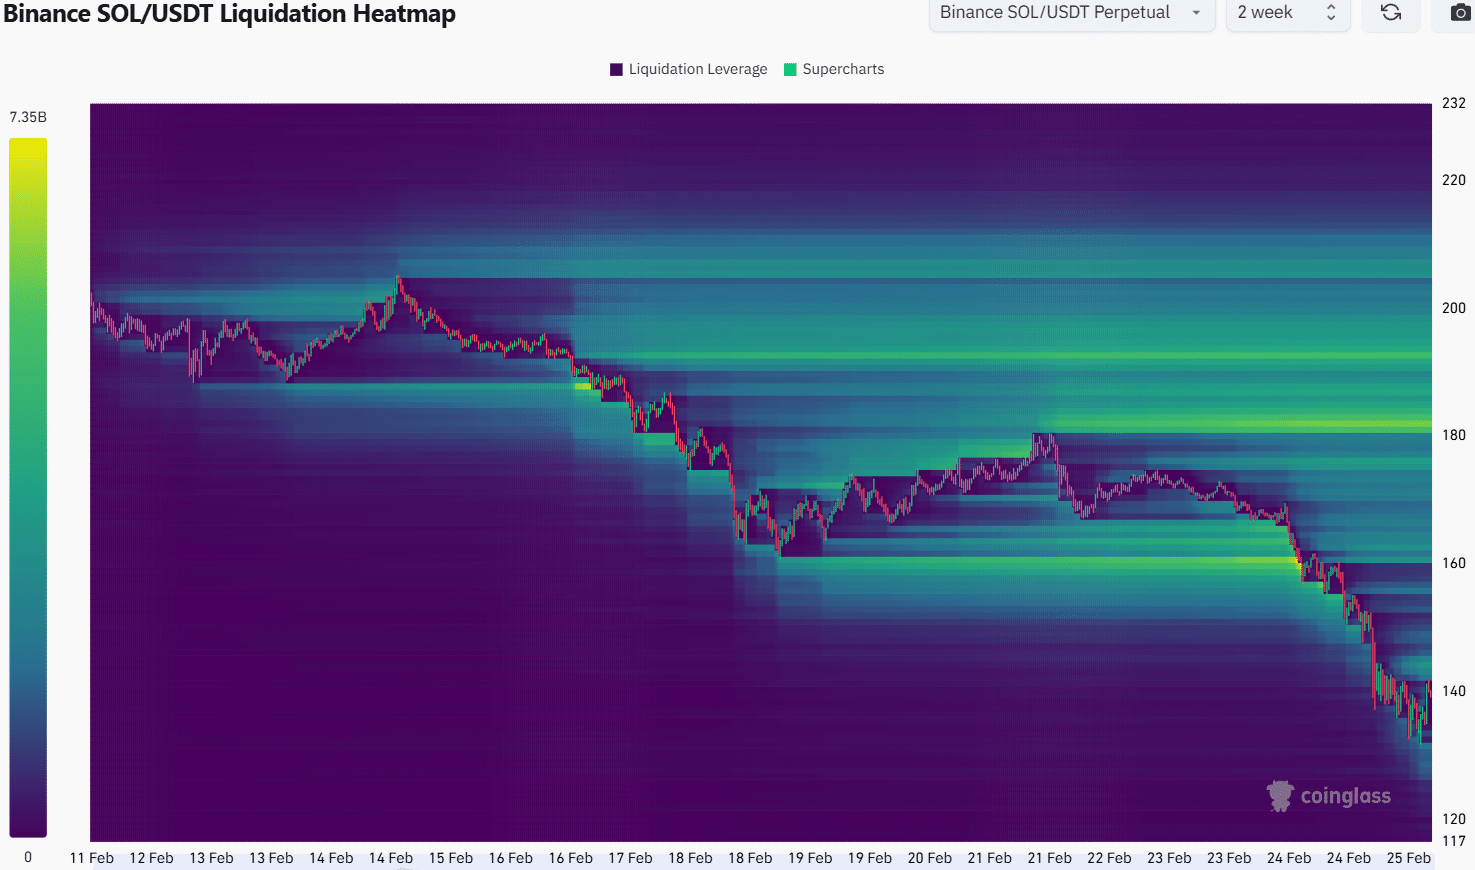
Source: Coinglass
The heatmap of the past two weeks showed that there weren’t strong magnetic zones nearby.
The $143 and $161-levels were potential short-term targets. The sparsity of liquidation levels above $140 means that in the coming days. SOL might struggle to push towards $160. This could change quickly if the token bounces above $150 and the Open Interest begins to climb.
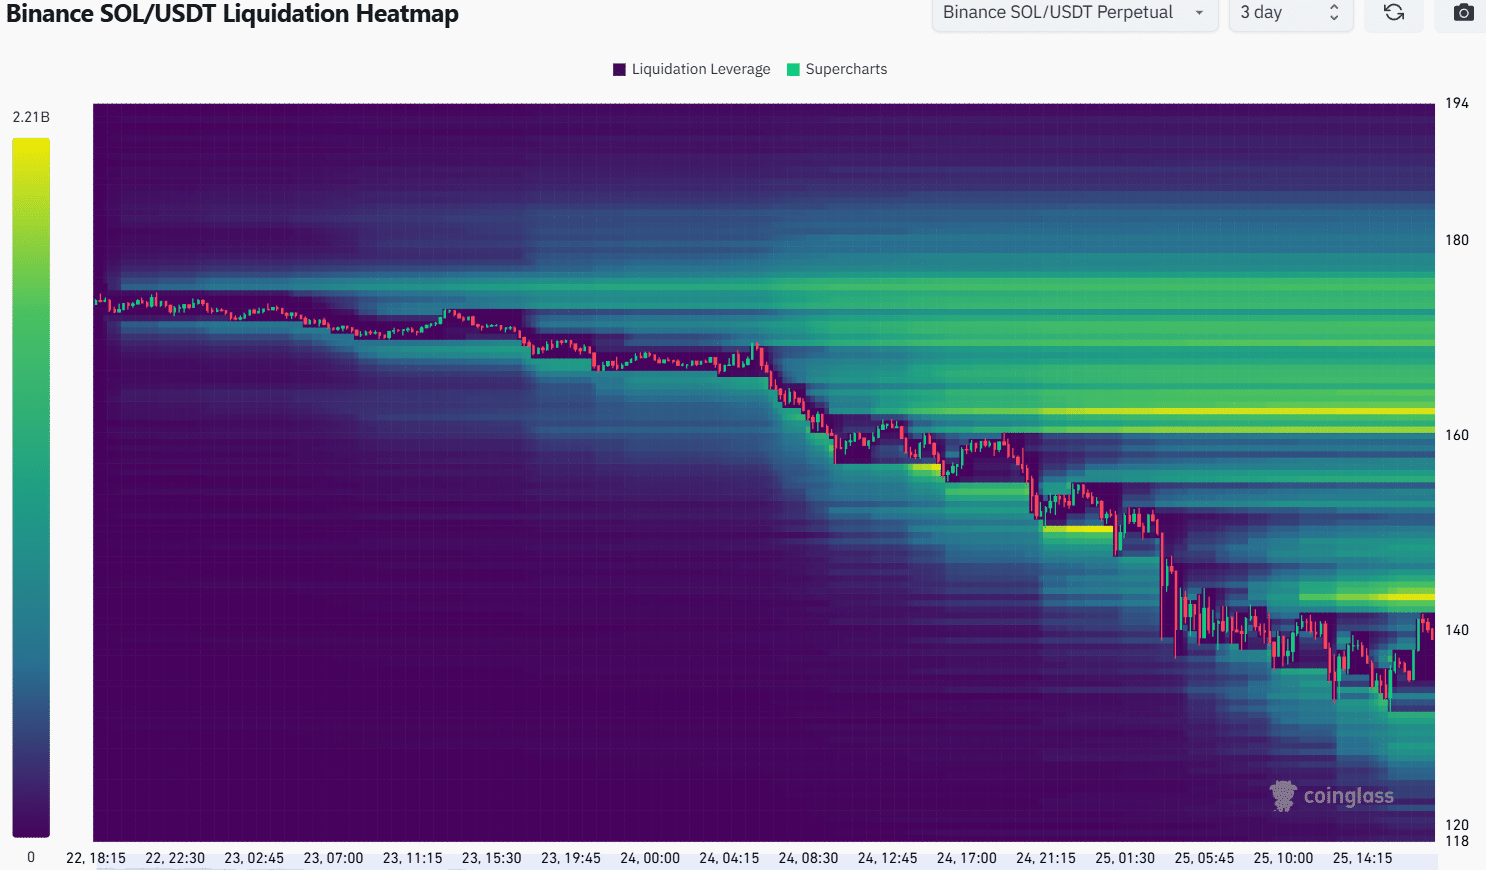
Source: Coinglass
Zooming in further, we can see that the $143-level is highly likely to be tested soon. Beyond that, the $160-$176 range is a target too, but this move might not materialize quickly.
It is possible that after collecting the liquidity at $143, SOL would fall towards $125-$130 before beginning a recovery. It is also uncertain if $120 can halt the bears. Hence, traders need to be careful and limit their risk due to the hike in volatility.
Disclaimer: The information presented does not constitute financial, investment, trading, or other types of advice and is solely the writer’s opinion